Showing posts with label foreclosures. Show all posts

Wednesday, April 10, 2013

CoreLogic Reports 54,000 Completed Foreclosures in February


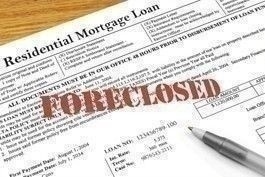
foreclosure_paperworkCoreLogic® recently released its National Foreclosure Report for February, which provides data on completed U.S. foreclosures and the overall foreclosure inventory. According to CoreLogic, there were 54,000 completed foreclosures in the U.S. in February 2013, down from 67,000 in February 2012, a year-over-year decrease of 19 percent. On a month-over-month basis, completed foreclosures fell from 58,000* in January 2013 to the February level of 54,000, a decrease of 7 percent.
As a basis of comparison, prior to the decline in the housing market in 2007, completed foreclosures averaged 21,000 per month nationwide between 2000 and 2006. Completed foreclosures are an indication of the total number of homes actually lost to foreclosure. Since the financial crisis began in September 2008, there have been approximately 4.2 million completed foreclosures across the country.
Approximately 1.2 million homes were in some stage of foreclosure in the U.S., known as the foreclosure inventory, as of February 2013 compared to 1.5 million in February 2012, a decrease of 21 percent. The foreclosure inventory as of February 2013 represented 2.8 percent of all homes with a mortgage compared to 3.5 percent in February 2012. This was the 16th consecutive month with a year-over-year decline. Month over month, the foreclosure inventory was down 1.8 percent from January 2013 to February 2013.
“February’s 54,000 completed foreclosures is the lowest level nationally since September 2007, with most major metropolitan areas experiencing improvements,” says Dr. Mark Fleming, chief economist for CoreLogic. “Even the major Florida markets are benefiting with the foreclosure inventories falling the fastest in major metropolitan areas, although from a very high level.”
“We continue to see a declining trend in foreclosure activity, with major markets leading the way,” says Anand Nallathambi, president and CEO of CoreLogic. “The drop in delinquencies and foreclosure starts will help support a resurgence in the home purchase market this year and next.”
Highlights as of February 2013:
• The five states with the highest number of completed foreclosures for the 12 months ending in February 2013 were: Florida (95,000),California (90,000), Michigan (73,000), Texas (57,000) and Georgia (49,000).These five states account for almost half of all completed foreclosures nationally.
• The five states with the lowest number of completed foreclosures for the 12 months ending in February 2013 were: District of Columbia (96), Hawaii (469), North Dakota (482), Maine (542) and West Virginia (588).
• The five states with the highest foreclosure inventory as a percentage of all mortgaged homes were: Florida (9.9 percent), New Jersey (7.2 percent), New York (5.0 percent), Nevada (4.6 percent) and Illinois (4.5 percent).
• The five states with the lowest foreclosure inventory as a percentage of all mortgaged homes were: Wyoming (0.5 percent), Alaska (0.6 percent), North Dakota (0.7 percent), Nebraska (0.8 percent) and Montana (0.9 percent).
For more information, visit www.corelogic.com.

Wednesday, March 20, 2013

What’s Up with the Housing Inventory?

Posted: 20 Mar 2013

We are honored to have Chip Wagner, an icon in the appraisal industry and our good friend, as a guest blogger today. Chip recently addressed the housing inventory challenges in the Chicago region. We believe that his observations can be applied to the majority of markets in the U.S. – The KCM Crew

Chip Wagner

It’s All About Supply and Demand

Definitions of Supply and Demand:
In classical economic theory, the relation between these two factors determines the price of a commodity. This relationship is thought to be the driving force in a free market. As demand for an item increases, prices rise. When manufacturers respond to the price increase by producing a larger supply of that item, this increases competition and drives the price down.
A theory explaining the interaction between the supply of a resource and the demand for that resource. The law of supply and demand defines the effect that the availability of a particular product and the desire (or demand) for that product has on price. Generally, if there is a low supply and a high demand, the price will be high. In contrast, the greater the supply and the lower the demand, the lower the price will be. The law of supply and demand is not an actual law but it is well confirmed and understood realization that if you have a lot of one item, the price for that item should go down.
In real estate appraisal context, the principle of Supply and Demand states that:
The price of real property varies directly, but not necessarily proportionately, with demand and inversely, but not necessarily proportionately, with supply.

My most simple explanation of Supply and Demand is: It is the relationship between sellers present in a market, which is the supply; and buyers looking, which is the demand. This relationship is reported in months’ supply of inventory.
 

So, what is the latest challenge?

 
Some (or most) might say that there are not enough “good” homes for sale. This could represent a shortage of supply, something we have not talked about for several years. It is allowing sellers to raise their asking prices and buyers who have been ‘shopping around’ are now willing to pay higher prices based on other homes they are comparing and/or contemplating to the home that they want.
 

Why do we have a shortage?

  • We are coming out of the worst decline (or correction) in real estate values for many generations – some pointing back to the early 1980′s, others are pointing back to the Great Depression.
  • In all of Chicagoland, our MLS showed a 37.6% decline in 5 years. The values hit their all-time high in the 3rd quarter of 2007 at $391,272, and by the 3rd quarter of 2012, they hit a low of $244,203.
  • The mean sales price at the end of the year in 2001 was $239,858, and year-end 2002 was $255,001. Therefore pricing as of the end of 2012 is at the same level that we were 10 years ago – sometime in 2002.

Why aren’t there many “good” homes for sale?


There are several contributing factors:

1. New construction – We are seeing new construction picking up again at all price points, which is certainly a positive. But with fewer builders, and more conservative approaches after getting burned, builders are not keeping up with the demand that is present. This is leaving buyers searching for resales. And because of the slowdown in new construction, (few new homes were built between 2007 and 2012) the nearly-new resales rarely exist.

Lack of new construction is a contributing factor as many builders folded or downsized significantly over the past 5-6 years.

2. Foreclosures – Foreclosures are a trend that is affecting supply of inventory. Banks are slower at foreclosing, in some cases taking over 3 years through the process. In some cases, the buyers aren’t even interested in these properties, and the investors are picking up these properties and flipping them at a profit.

Foreclosure properties, once viewed as a deal perhaps 25% to 40% under market values, are now being sold at only a 7% discount according to RealtyTimes.com.

3. Investors – Investors have entered the market at greater levels, some to purchase properties to rent, others to rehab and flip them. With the high inventory, investors were able to seek out the best deals, now there are fewer homes available for them.

4. Few people really want to sell at the bottom – Personally, I think the biggest reason that our inventory is low is simply because everyone wants to buy at the bottom; but what seller really wants to sell their home at the bottom of the market? That being said, there are many sellers who cannot sell.
Recently, I heard Steve Harney speak at the Leading Real Estate Companies of the World Conference; he stated there are over 10 million people that are still under water and cannot sell their homes. That is a significant number – these are ‘move-up buyers’ that will create a domino effect. A portion may also represent the potential downsizing buyers who have that upper priced home to sell. This is a very complicated situation. There are many opportunities in the market as demand continues to surge.

Move-up sellers have pent up demand and are ready to buy – if they can sell!

Remember, our market dropped 37.6% as a region since 2007 (some areas fell less than 20%, and other areas fell greater than 50%). The buyers with 20% down lost equity in their homes. Buyers with 5% or 10% lost substantial equity in their homes. If they sell today, they don’t have the down payment necessary for that next home.

Various predictions by “experts” suggest our recovery may be anywhere between 2% and 8% annually. At a conservative 4% annual rate of recovery, it is 5 more years before we can reach 20%.  Those who last purchased their home between 2006 and 2008 are being hurt the hardest in today’s market.
One positive is that renters are ready to purchase. Generation X and Y buyers now believe in homeownership; they want to get out of renting apartments because rents continue to go higher than taking out a mortgage. Interest rates remain at historic lows, with no indication of a significant increase of rates on the horizon.

From the 3rd quarter to the 4th quarter, Chicagoland saw its first quarter to quarter increase in sales price since prices began falling five (5) years ago. All indications are that this trend is continuing. But the increase, although welcome news, is very small. (+0.13%). Many communities throughout Chicagoland are seeing more substantial increases, some are not yet seeing increasing values. (44%, or 84 out of 191 communities) saw increases over the past quarter.

Back to Supply and Demand …


A balanced supply of inventory is considered to be 4 to 6 months. A balanced supply is going to be neutral in pricing, while an undersupply is going to lead to upward pressure on prices – a Seller’s Market. An oversupply will lead to downward pressure on prices – a Buyer’s Market.

Our supply of inventory is at its lowest level since the end of 2006 and most areas have been reduced to a balanced supply of inventory, with undersupply observed in many sub-markets in the region.
Chicago Detached housing is 3.88 months, and Attached housing (condos, townhomes, Co-ops and duplexes) is 2.87 months supply!

The anticipation is that the pricing will continue to be pressured upward as the desirable properties (in terms of location and condition/modernization) will be gobbled up. Remember the multiple-contracts driving up values last decade? Many agents are now experiencing these trends again.

Get ready for a wild and crazy ride as our real estate market in Chicagoland is pulled and pushed in all directions in 2013

This could lead to things that do not make sense in the crazed market. Real Estate professionals (Agents and Appraisers alike) must take care to understand all of the nuances in the market signaling the positives taking place.

Just what we need: more complications to try to understand.

Here are a few things to watch…


  • Watch the days on market (DOM). Take time to understand if an area’s high DOM may be due to stale listings of homes that are overpriced, distressed and/or in inferior condition.
  • Trend the increasing Sales Price-to-List Price ratios - in many sub-markets that I appraise in, I have seen these trend from 93% to 96% or higher just in the past year.
  • Track the number of pendings in relationship to the number of listings? One appraiser friend of mine tracks this and calls this “market velocity.” Right now, I see some areas where there have more pendings than listings in a given sub-market.
  • Are the pendings priced higher than the previous sales prices? Another indication of an increasing market that I am seeing in many areas.
Welcome to, we all hope, the Housing Market Recovery!

If you are thinking of buying a home in Westport or surrounding areas please visit www.DistinctiveHomes-NE.com for a free list of homes for sale in Westport and Bristol County MA and RI.

If you are thinking of selling your home contact me for a FREE Current Market Analysis and to learn about our Market Plan to get your home SOLD!

We work with one going in mind, YOURS!


Noemi Cardoso
Local Office. Local Agents. Local Knowledge.

William Raveis Real Estate
911 Main Rd - Westport MA 02790
Cell: 508-558-1945

www.DistinctiveHomes-NE.com
noemi@DistinctiveHomes-NE.com

Wednesday, December 19, 2012

Are Foreclosures Increasing or Decreasing?

by The KCM Crew on December 19, 2012 ·
 
 
Recent headlines have created tremendous confusion regarding the foreclosure situation in the country. Let’s give an example. Which of these two headlines are accurate?
 
Foreclosure Starts Plunge to 71-Month Low
Foreclosures Increase for the First Time Since 2010

The challenge is that both headlines are 100% accurate. How can foreclosures have increased for the first time in two years and, at the same time, be at a six year low? Each headline was reporting on a different measurement. Below are the explanations for each of the measurements as per RealtyTrac’s most recent Mortgage Foreclosure Report.

Foreclosure Starts


Foreclosure starts are the first steps taken by the bank after the borrower becomes delinquent on their mortgage payments (default notices or scheduled foreclosure auctions, depending on the state). They were filed for the first time on 77,494 U.S. properties in November. This was:
  • Down 13% from the previous month
  • Down 28% from November 2011
  • At the lowest level since December 2006

Foreclosures (Bank Repossessions)


This is when the lender completes the foreclosure process and repossesses the property. This occurred on 59,134 U.S. properties in November. This was:
  • An 11 percent increase from the previous month
  • A 5% increase from November 2011
  • The first year-over-year increase in bank repossessions since October 2010, when the practice of robo-signing foreclosure documents came to light and caused a sharp slowdown in foreclosure activity in the following months
In the report, Daren Blomquist, vice president at RealtyTrac, explained:
“The drop in overall foreclosure activity in November was caused largely by a 71-month low in foreclosure starts for the month, more evidence that we are past the worst of the foreclosure problem brought about by the housing bubble bursting six years ago. But foreclosures are continuing to hobble the U.S. housing market as lenders finally seize properties that started the process a year or two ago — and much longer in some cases.”
We hope this brings some clarity to the situation.

If you are thinking of buying a home in or around Bristol County MA or RI, please visit www.DistinctiveHomes-NE.comfor a free list of homes for sale in Westport MA and surrounding towns.

Would you like to receive a current market update of your specfic area? Contact me with your request.

If you are thinking of selling your home contact me for a FREE Current Market Analysis and to learn about our Market Plan to get your home SOLD!

We work with one going in mind, YOURS!


Noemi Cardoso
Local Office. Local Agents. Local Knowledge.
William Raveis Real Estate
911 Main Rd - Westport MA 02790
Cell: 508-558-1945
www.DistinctiveHomes-NE.com
noemi@DistinctiveHomes-NE.com
Thursday, October 4, 2012

The Mortgage Forgiveness Act: Will It Be Extended?

by The KCM Crew on October 3, 2012
    As the year winds down, we are getting more and more inquiries about the Mortgage Forgiveness Debt Relief Act of 2007 and whether or not it will be extended past its original expiration date of December 31, 2012. This is important as people who are selling their home through a short sale may be faced with a tax liability if they don’t close by the aforementioned date.
Here is the way the IRS explains the tax liability:
“If you borrow money from a commercial lender and the lender later cancels or forgives the debt, you may have to include the cancelled amount in income for tax purposes, depending on the circumstances. When you borrowed the money you were not required to include the loan proceeds in income because you had an obligation to repay the lender. When that obligation is subsequently forgiven, the amount you received as loan proceeds is normally reportable as income because you no longer have an obligation to repay the lender. The lender is usually required to report the amount of the canceled debt to you and the IRS on a Form 1099-C, Cancellation of Debt.
Here’s a very simplified example. You borrow $10,000 and default on the loan after paying back $2,000. If the lender is unable to collect the remaining debt from you, there is a cancellation of debt of $8,000, which generally is taxable income to you.”

What does the Act accomplish?

Let’s go back to the IRS for the explanation:
“Normally, debt that is forgiven or cancelled by a lender must be included as income on your tax return and is taxable. But the Mortgage Forgiveness Debt Relief Act allows you to exclude certain cancelled debt on your principal residence from income. Debt reduced through mortgage restructuring, as well as mortgage debt forgiven in connection with a foreclosure, qualifies for the relief.”
(For more information on the ACT from the IRS, click here)
This relief also applies to most short sales. Therefore, the question of whether or not the Act will be extended is crucial for anyone considering selling their house through the short sale process.

Will the Act be extended past the end of the year?

No one knows for certain. Diana Olick of CNBC recently reported on the issue:
“So what is the possibility of congress extending the tax relief? One Hill-watcher puts it at 60-40. The Senate Finance Committee passed a package of tax extenders right before the recess, including a one year mortgage relief extension, but leadership in the House of Representatives has not figured out how it wants to handle these extenders. With the looming ‘fiscal cliff,’ tax cuts are an increasingly tough sell. This particular extension does have bipartisan support, but that doesn’t always mean passage in Congress, especially around a presidential election.”
Without knowing whether the Act will be extended, we suggest anyone considering selling via the short sale process do it now.

If you are thinking of buying a home in Westport MA visit www.DistinctiveHomes-NE.com for a free list of homes for sale in Westport MA.

If you are thinking of selling your home contact me for a FREE Current Market Analysis and to learn about our Market Plan to get your home SOLD!


Noemi Cardoso
RE/MAX Welcome Home
Cell: 508-558-1945
Home Office (Westport) 774-264-9085
www.DistinctiveHomes-NE.com
noemi@DistinctiveHomes-NE.com

Tuesday, August 21, 2012

Housing Update from Ashley Garner

Posted: 21 Aug 2012

Today we are honored to have Ashley Garner, one of the great young minds in real estate, share with us his thoughts on today’s national housing market. Enjoy! – The KCM Crew

The Good News Is…


The recovery of the Real Estate Market is unfolding exactly as it should and exactly as we have predicted. We are still in “Step 1” of the recovery, which basically is working to sell off the current oversupply of inventory (too many homes for sale). This oversupply is the reason prices have not yet started to rise in many parts of the country.

The number of sales is increasing nicely and that is one way we know the recovery is taking place. When the number of homes for sale reaches a level that results in a 5-6 month supply we will then be back in a “normal” market, instead of the “buyers market” we have had over the last few years. Once we are back in a “normal” market, prices will begin to go up at a healthy rate of about 3% per year (3% appreciation…versus the depreciation we have had). Some other factors that let us know the recovery is under way are the fact that pending home sales (under contracts) are at their highest level since 2007 and prices on average are at 2003 levels (this shows prices have adjusted downward as a result of the oversupply).

Gaining Perspective

on what this all means to you should be your biggest concern and that depends on your point of view.

Sellers:

This all means that your house is worth as much today as it is going to be worth for a while. Prices are not fluctuating by large amounts right now they are either up or down by very small percentages. Even when the market begins to return to normal the gains per year will be small and gradual (1% to 3% annually). Some projections say that in the next 18 months there will be an increase in value of 1%… Here’s the perspective you need, if you want to wait for a year and a half for prices to go up the most you would gain is 1%, so if you have a $250,000.00 house you would be waiting 18 months for $2500.00….doesn’t seem worth waiting for, does it? Especially when you consider what your reason for moving is in the first place. If you are moving to be close to your grandchildren is it worth waiting until they are two years old before you are closer to them just so you can have $2500.00 more dollars? Just one example….

Buyers:

There is zero question that now is the time to buy a home. Even if you have a home to sell (see section above about Sellers). The selection of homes is incredible (Buyers benefit from the oversupply because selection is great and prices are great) Also, as of this writing, interest rates for 30 year fixed rate mortgages are 3.59% this is so low it is unheard of….this is what you would call “cheap money”! Don’t wait until the market has recovered because if you do the selection of homes will not be as good, the prices will be higher and the interest rates will be higher….probably much higher.

Investors:

You should be rejoicing. This kind of market only comes around once in a generation or so. Money is cheap and prices are low. The rental market is extremely strong right now, it’s certainly a “landlords” market. Houses are now cash flowing and showing very good returns on investment. Investors, if you wait, you will miss your best chance at earning the wealth that history proves is best earned in real estate.

In summary, sometimes in life you really have to step back and gain some perspective. Waiting is sometimes the right course of action…as long as you know the value of what you are giving up by waiting….

You may make 1% more or you may lose 1% less but maybe not….the one thing you know for sure is that time waits for no man (or woman) – you can never get today back. You can never spend the time with your grandkids that you’ll miss while you are waiting on a 1% gain to your home’s value. Don’t be the one we have all heard say….”If Only”….

Before you decide to Sell or Buy a home in Birstol County, don't pass the opportunity to work with a reliable and caring professional who gets the job done. Start your search at the best real estate website in the South Shore www.DistinctiveHomes-NE.com

Noemi Cardoso
RE/MAX Welcome Home
Serving Westport, Dartmouth, Fall River, MA
Little Compton, Tiverton, RI and surrounding towns.
www.DistinctiveHomes-NE.com

Friday, July 27, 2012

Short Sale vs Foreclosure: the Prices

by The KCM Crew on July 27, 2012 ·

This week, we are looking at the advantages of a short sale over a foreclosure from five different perspectives: Sellers’, Neighborhoods’, Banks’, Prices and the Children. – The KCM Crew
All distressed properties put downward pressure on prices. However, the impact of a short sale is nowhere as drastic as the impact of a foreclosure for two major reasons:
  1. A foreclosure, in most cases, leaves a vacant house in the neighborhood. Vacant, unmaintained homes have a negative impact on the value of other houses in the area.
  2. When a distressed property sells, it can then be used as a comparable sale in the appraisals of all other sales in the market including the appraisals of non-distressed properties. Since foreclosures sell for approximately 10% less than short sales, they do more damage on the appraisals of other homes.
A short sale impacts the values of other homes to a lesser degree than a foreclosure.

Tomorrow, we will look at the impact of a short sale compared to a foreclosure on children.

If you are seriously thinking of buying or selling, or just plain curious to see what’s happening in your area of interest, start your search at the best real estate website www.DistinctiveHomes-NE.com

Noemi Cardoso
RE/MAX Welcome Home
Serving Westport, Dartmouth, Fall River, MA
Little Compton, Tiverton, RI and surrounding towns.
www.DistinctiveHomes-NE.com

Thursday, July 26, 2012

Short Sale vs Foreclosure: The Banks

by The KCM Crew on July 26, 2012 ·

This week, we are looking at the advantages of a short sale over a foreclosure from five different perspectives: Sellers’, Neighborhoods’, Banks’, Prices and the Children. – The KCM Crew
The banks are beginning to favor offering a short sale to distressed homeowners rather than foreclosing for several reasons:
  • The short sale sells on average for $27,000 more than a foreclosed property.
  • The bank does not have to take on the expenses and maintenance of a vacant home in a short sale.
  • The banks realize a vacant house impacts the values of other homes in the area thus devaluing assets that they may also hold a mortgage on.
  • Some courts have questioned whether the foreclosure process was correctly followed on some homes. This could place a cloud on the title of such homes. In a short sale, there are no title challenges as the original seller signs away title at the closing.
It is for the above reasons that bankers are beginning to favor short sales over foreclosures.

Tomorrow, we will look at the impact of a short sale compared to a foreclosure on prices.

If you are seriously thinking of buying or selling, or just plain curious to see what’s happening in your area of interest, start your search at the best real estate website www.DistinctiveHomes-NE.com

Noemi Cardoso
RE/MAX Welcome Home
Serving Westport, Dartmouth, Fall River, MA
Little Compton, Tiverton, RI and surrounding towns.
www.DistinctiveHomes-NE.com

Wednesday, July 25, 2012

Short Sales vs Foreclosures: the Neighborhood

by The KCM Crew on July 25, 2012 ·

This week, we are looking at the advantages of a short sale over a foreclosure from five different perspectives: Sellers’, Neighborhoods’, Banks’, Prices and the Children. – The KCM Crew


A foreclosure, in most cases, leaves the block with a vacant home. A short sale does not. A vacant house in a neighborhood creates several challenges:
  1. It doesn’t contribute to the tax base of the region.
  2. It can be an eyesore and bring down the image of the area.
  3. It can be a breeding ground for insects (example: mosquitoes, ticks, etc.).
  4. It can be an incubator for crime if occupied by vagrants or transients.
  5. It can create safety issues for children (example: unguarded pool).
If a short sale is the result rather than a foreclosure, it is much better for the neighborhood .

Tomorrow, we will look at the impact of a short sale compared to a foreclosure on the banks.

If you are seriously thinking of buying or selling, or just plain curious to see what’s happening in your area of interest, start your search at the best real estate website www.DistinctiveHomes-NE.com

Noemi Cardoso
RE/MAX Welcome Home
Serving Westport, Dartmouth, Fall River, MA
Little Compton, Tiverton, RI and surrounding towns.
www.DistinctiveHomes-NE.com